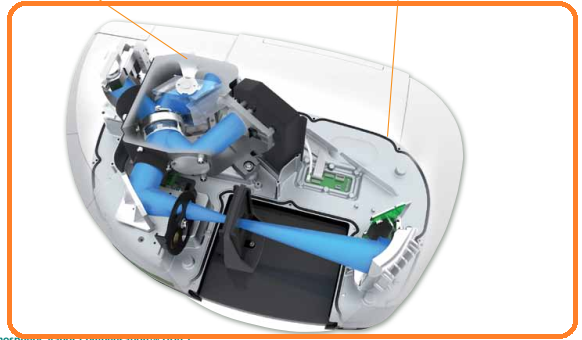
Calibration of Fourier Transform Infrared
Spectrophotometer (FTIR)
Procedure:
Cleaning:
·
Check that the power supply to the instrument
Should be switched OFF before cleaning.
·
Clean the Instrument with a clean dry cloth
every day.
·
Clean the UATR properly after each analysis.
Operating Instructions:
·
Put on the main power supply of instrument.
·
Switch on the instrument and computer attached
to the instrument taking care that while switching on the instrument only
normal base accessory shall be placed in the instrument.
·
Double click on the spectrum icon to open the
software.
·
Feed your user name and password and press
enter.
·
Click on < Connect> to Connect the
Instrument.
Background Selection:
·
Go to <Measurement Menu> Select<
Background> to start background.
·
After completion of background, prepared
standard and sample as per standard test procedure.
Preparation of Sample table (Using UATR
accessory):
·
Go to<View> Select <Data explorer>.
·
From the left side assistant bar select sample
table and fill the parameters regarding to sample ID and description.
·
Select the data Path location from the top of
sample table by click on browse.
·
Go to left side assistant bar and select sample
view.
·
Go to <set up menu> Select <
instrument>. A set up window is open in bottom side.
·
Go to < Set up instrument basic> and set
the parameter as per requirement. Then <load & Save>. Click <Save
current setting> and press ok.
Scanning for Solid samples
·
Place the Respective Standard & Sample on
the crystal in the sequence of sample
Table.
·
Give the pressure 30 to 40.
·
Go to sample table and select standard as well
as sample which put on the crystal.
·
Go to <measurement> Select <Scan> to
Started Scanning.
· Click on sample table on top right side and click to save.
Scanning for Liquid samples
·
Place the liquid sample put on UATR crystal by
using syringe.
·
Go to sample table and select standard as well
as sample which put on the crystal.
·
Go to <measurement> Select <Scan> to
Started Scanning.
·
Click on sample table on top right side and
click to save.
Comparison of sample spectra with standard spectra or to
overlay the spectra
·
Select the spectra to be compared with standard
spectra by clicking on < file > and Select the spectra to be compared
with standard spectra by clicking on < file > and then on <open> and selecting the
required spectra from opened window & click on open and let it be displayed
on screen.
·
Go to <setup Menu> Select < compare>
to open a setup window in bottom side to
select <setup compare reference> and Add Standard and Tick (√) on
Correlation for result Pass/Fail.
·
Go to sample table to select respective Sample
which compare with standard.
·
Go to <Process>Select <compare> to
comparing Started.
Data Printing
·
Go to Sample View from the left side assistant
bar to select the data for printing.
·
Go to <file menu> select < report>
select < template> Select threw Browse< compare template> and press
enter.
·
Feed your user name and password and press
enter.
·
Take final print out by clicking on print.
·
Enter all necessary entry in Usage log book of
instrument.
Calibration
Calibration Frequency: Quarterly
Calibration perform in three Parts:
1. EP
Resolution Performance Test
2. EP
wave number verification test
3. Signal
to Noise Ratio Test
Process
·
Place the normal base accessory carefully.
·
Go to <Setup menu> select <instrument
Verification> a setup window is open at the bottom side.
·
Go to setup instrument Verification.
·
Go to instrument check, deselect the Abscissa,
ordinate, noise and ASTM and select MIR Pharmacopoeia and then select European
test.
·
Go to report and select both Show report
automatically & Print report automatically.
·
Go to <Measurement menu> Select <
instrument check> then click <instrument Verification>.
·
Instrument Verification-EP Resolution
Performance Window is open.
·
Read the instruction carefully then click scan.
·
Follow the instruction onscreen carefully to
complete the calibration.
· SNR (Signal To Noise Ratio Test) (can be perform By Administrator only)
Process
Go to my computer to< C: drive> to <Program
file> to <PerkinElmer> to < service IR> to <install
instrument> and follow the instruction on screen run performance test.
Data printing
Go to my computer to< c: drive> to <Program
file> to <PerkinElmer> to < service IR> to <Instrument Serial
no.> to <Performance test> open this file and then print.
Action to be taken in case unsatisfactory results
·
If calibration of FTIR not match with acceptance
criteria, inform Head/Designee-QC and affix the label ‘Out of Calibration’ to
the instrument.
·
Do not use the Instrument if it is out of
calibration.
·
Executive/Designee QC will inform to Maintenance
Department.
·
Get the instrument corrected and recalibrate the
instrument.
CALIBRATION OF FOURIER TRANSFORM
INFRARED SPECTROPHOTOMETER (FTIR)
Instrument ID No. :
Date of calibration :
Next due date for calibration :
Frequency of
calibration : Quarterly
1. Wave
number verification test:
|
Wave
number |
Observation |
Acceptance
Criteria |
|
3060.0 |
|
3059.00 to 3061.00 |
|
2849.5 |
|
2848.50 to 2850.50 |
|
1942.9 |
|
1941.90 to 1943.90 |
|
1601.2 |
|
1600.20 to 1602.20 |
|
1583.0 |
|
1582.00 to 1584.00 |
|
1154.5 |
|
1153.50 to 1155.50 |
|
1028.3 |
|
1027.30 to 1029.30 |
2. Resolution:
Absorbance mode:
1.)
Difference between the absorbance’s at
2849.5 cm-1 and 2870 cm-1 = …………...(> 0.33)
2.)
Difference between the absorbance’s at
1583 cm-1 and 1589 cm-1 = …………..... (> 0.08)
3. Signal to
noise ratio
Observation:
………………………………. Limit (NLT 6500)
